
Geocoding (Address Matching)
This tutorial provides step by step instructions for matching a table of addresses to a geographic database using ArcGIS technologies. This process is called “Geocoding”. Geocoding consumes ‘credits’ in the Esri ecosystem. As a user at Brock University (or other ‘organization’ with a site license) you will be allocated a limited number of credits. Brock University affiliates should contact maplib@brocku.ca before attempting to geocode a table with more than 1000 records.
More details about credits can be found here.
Setup Instructions
In preparation for this tutorial, you will need an organizational account. As a Brock University affiliate, you already have such an account. The first part of the tutorial will outline steps for accessing the software using your Brock credentials. Video instructions.
NOTE: ArcGIS Pro is a Windows-based software and will NOT run on a Mac computer unless you have Parallels or Bootcamp installed. Contact Campus ITS in the Campus Store for more information.
NOTE: Brock University has a site license for ArcGIS Pro. Therefore, you may download and install the software on any Windows machines for academic and research purposes. ArcGIS Pro can be found on any PC across campus. The Map, Data & GIS Library also has a special Alienware PC for use by the Brock community.
Download the Excel file used in this tutorial. Niagara Sports Facilities acquired from https://niagaraopendata.ca/dataset/niagara-sports-clubs-facilities.
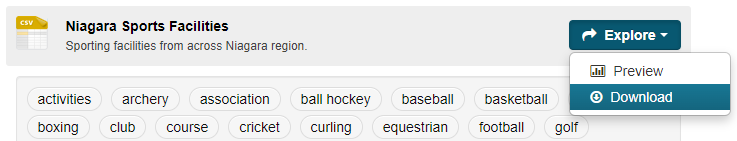
OR… The CSV is also available here.
Geocoding with ArcGIS Pro
- Run ArcGIS Pro on your Windows-based machine. Instructions for geocoding using ArcGIS Online follow the ArcGIS Pro tutorial.
- Sign in using your Brock credentials as per this video (NOTE: download instructions are also included in the video)
-
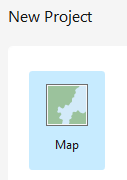
New Project > Map
-
Create a new project (“Geocoding Tutorial”) and define the working directory (local storage is recommended).
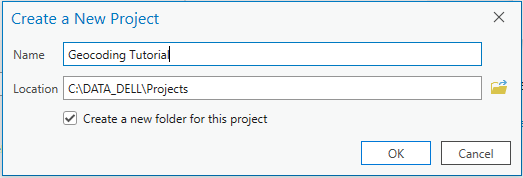
- Click OK. The software generates a new map project with a project folder and geodatabase.
- By default there is a basemap projected to WGS 1984 Web Mercator (auxillary sphere).
- Click the Map tab at the top and click the Add Data button.

-
Browse to the download directory holding the NiagaraSportsFacilities.csv. Select the file and click OK. The table appears in the Contents pane under Standalone Tables:

- Right-click the table under Standalone Tables and click Open. Browse the attributes and notice the address fields. We will match the addresses in the table with the Esri World Geocoder to plot points on the map.
- Close the table.
- Right-click the table under Standalone Tables and click
 . The Geocode Table wizard appears to the right of the map view. Navigate through the pages as follows.
 - Page one outlines the steps involved. Click Start at the bottom of the page.
- Step One: from the Input Locator box, select ArcGIS World Geocoding Service
 . Click Next.
NOTE: Geocoding consumes credits. Please contact maplib@brocku.ca before attempting to geocode a table with over 1000 records.
- Step Two: This page prompts you to identify how your data is structured. This particular table has the addresses stored in more than one field. Accept the default and click Next.
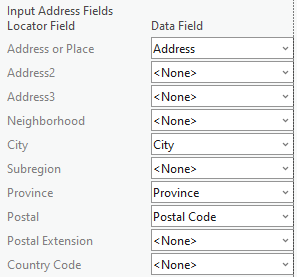
- In Step Three, the software attempts to match fields in the CSV with known fields in the address locator. Accept the defaults and click Next.
- For Step Four: Output, you can define where the resulting feature layer is created. Accept the defaults for now and click Next.
- For Step Five: Select Canada. This helps the software know the location more accurately. Click Next.
- For Step Six: Select the categories Address and Postal
 . Click Finish.
 - From the summary page, notice the option at the top to calculate an estimate of how many credits will be consumed. Users at Brock University will have 300-500 credits by default. This activity will consume approximately 9 credits.
- At the bottom of the page, click Run.
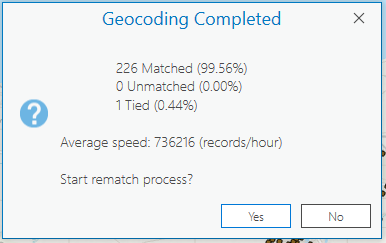
- When the process is finished, you will see a Geocoding Completed window. Here you will have the option to rematch any unmatched records. Click No.
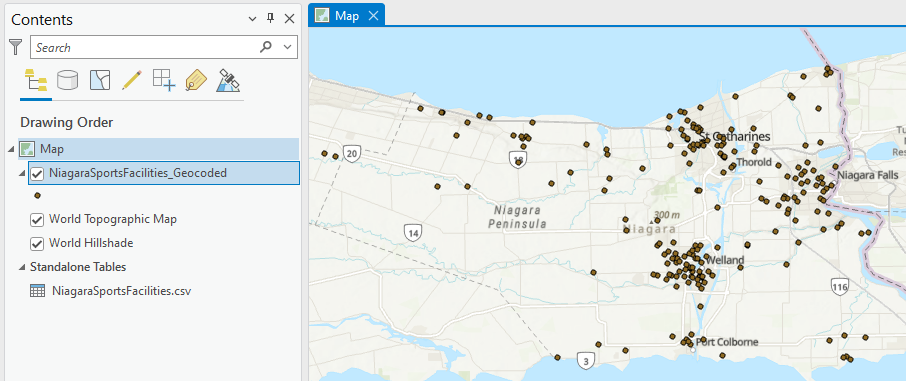
The map now displays points representing sports facilities in the Niagara Region and you will see a new feature layer in the Contents pane on the left.
Geocoding with ArcGIS Online
- Go to https://arcgis.com and sign in as per the instructions above.
NOTE: Geocoding in ArcGIS Online is limited to users with an organizational account.
-
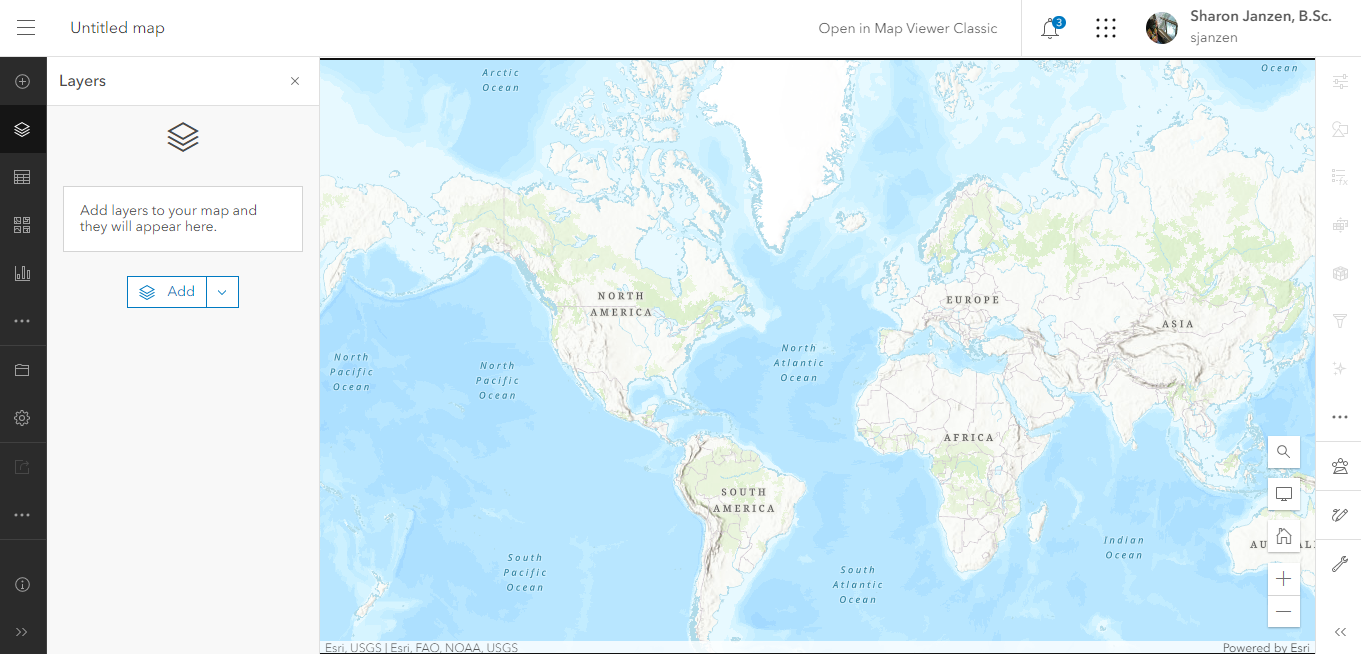
Click the Map option at the top of the screen.
This software as a service is constantly being updated. At the time of writing, the simplest way to plot points is to Add layer from file. Follow these steps:
- Click the little arrow beside the Add button
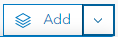
- Select the option to Add Layer From File.
- Click
- Browse to your downloaded sports facilities table, select the csv and click Open. You will be taken through a series of prompts.
- Select Create a hosted feature layer and add it to the map. Click Next.
- This prompt allows you to identify the fields to include with the hosted feature layer. Accept the defaults and click Next.
- From the location settings, change the default selection to Addresses or place names
 .
. - Scroll down a bit and change the option for Location Fields.
 .
. - Scroll down to see how the software is matching the fields. You will need to select the field for Postal Code.
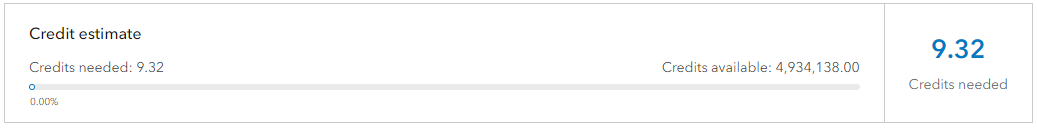
- Scrolling down a little further will reveal approximately how many credits will be used to geocode the table.
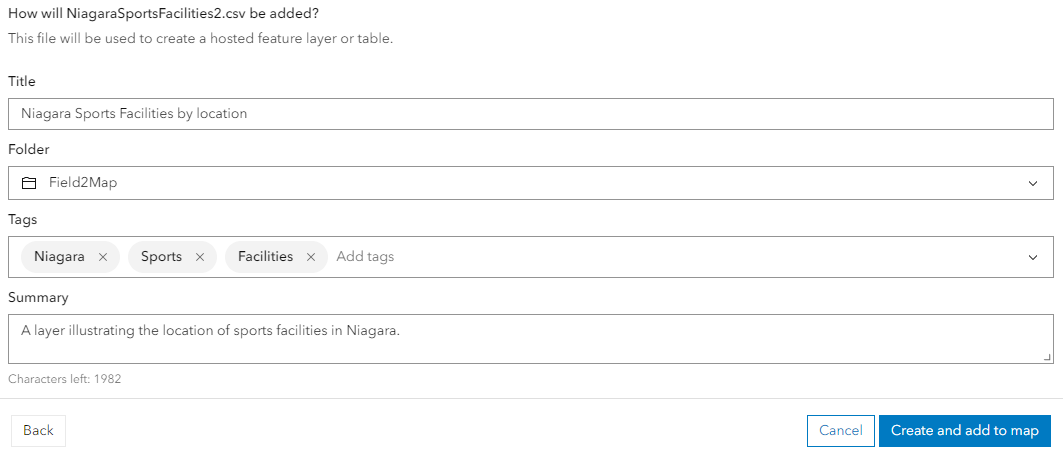
- Click Next. This page offers the option to change the layer name, storage location in ArcGIS Online and to add Tags (keywords) and a Summary.
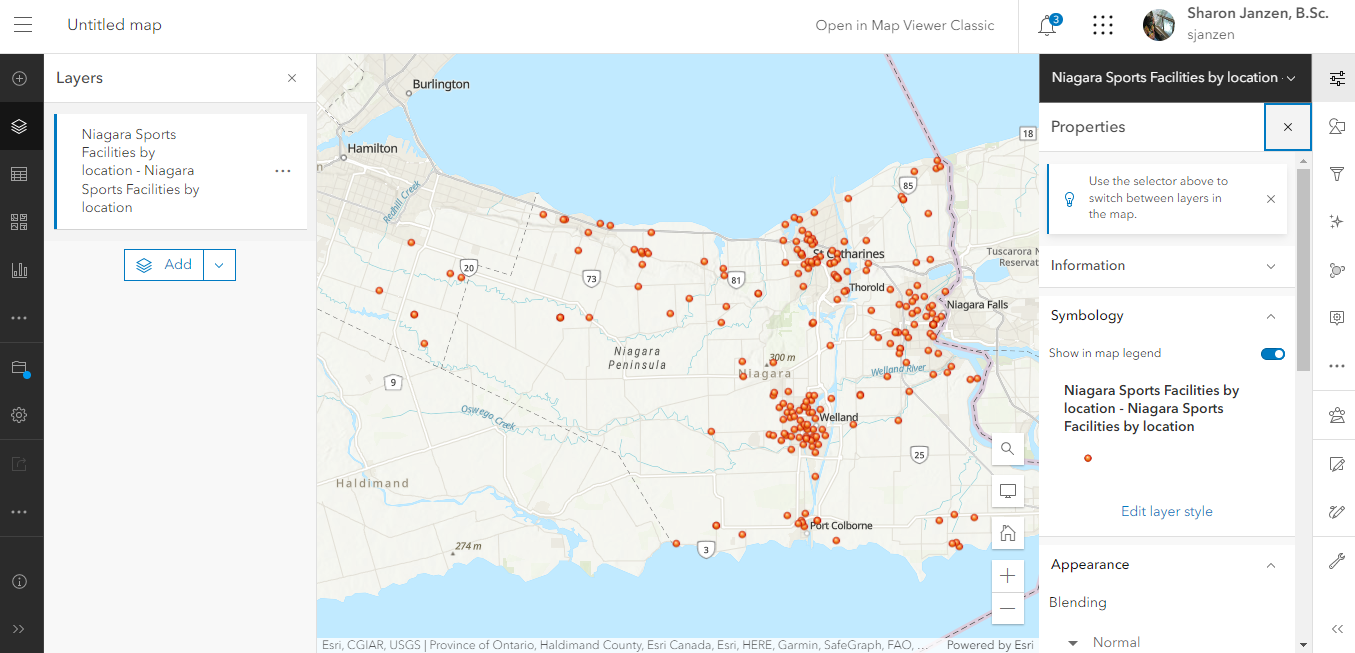
- Click
 . The results show the location of sports facilities across the Niagara Region.
Next Steps (Optional)
Joining tabular data to geospatial data
This tutorial is supported by the Brock University Research Lifecycle Department; Map, Data & GIS Library. If you have any questions or concerns regarding this tutorial, don’t hesitate to contact maplib@brocku.ca