Identifying Food Desert Neighbourhoods in the Niagara Region
Introduction
For this project, I will explore neighbourhood data using ArcGIS Insights to identify food desert neighbourhoods in Niagara Region. Data for the purpose of this project were gathered from Niagara Open Data and Niagara Poverty Initiative websites. Variables that will be examined to identify food deserts are distance to supermarkets and number of supermarkets. I will also analyze the data to detect spatial patterns. Finally, I will share my work on ArcGIS online and create new shapefiles from my results.
Project Procedures
1 . Download the Niagara Food Deserts compressed folder from the GitHub link below: https://github.com/pdwomoh/Philip-Dwomoh-DSL-Project
2 . Locate the downloaded file on your computer. Right-click the file and extract it to a location where you can easily find it, such as your Documents folder.
3 . Sign in to your Insights Online account:https://insights.arcgis.com/#/
Note: If this is your first time using Insights, the Welcome to Insights window appears with a list of things you can do with Insights.
4 . If necessary, in the Welcome to Insights window, click Skip.
5 . Click the Workbooks tab.
6 . Click New workbook.

Note: The Add To Page window appears. In this window, you can choose a dataset to add to your new workbook. You can choose data hosted in your ArcGIS organization, data in a file on your computer, or data from Living Atlas.
7 . In the left pane, click Files.

8 . Click Browse my computer. Browse to the extracted Niagara Food Deserts folder and select Book1.xlsx. and NhbBoundaries compressed zip folder and click Open.
9 . In the Selected Data pane, click Add.

The datasets are added to a new card in your workbook. You use cards and pages to organize information in a workbook. Each page can contain multiple cards, and each card can contain a map, chart, or table.
10 . Click Untitled Workbook, type Niagara’s Food desert Neighbourhoods and press Enter.
11 . Click Page 1, type Data Exploration, and press Enter.
12 . In the data pane, point to Book1 and click Rename dataset.

13 . Type Food Desert Data and press Enter.
14 . Repeat the above step and rename NhbBoundaries to Niagara Neighbourhood Boundaries and press Enter.
15 . Point to Food Desert Data, click Dataset Options, and choose Enable Location.

16 . In the Enable Location window, for Location type, choose Geography. For Location Fields choose Multiple, and for the Multiple Fields choose NHB_NAME and MUN. For Matching Geography Level, choose Niagara Neighbourhood Boundaries.

17 . Click Run.
18 . When the Enable Location tool finish loading, a new locations attribute named Niagara Neighbourhood Boundaries is added to Food Deserts Data.
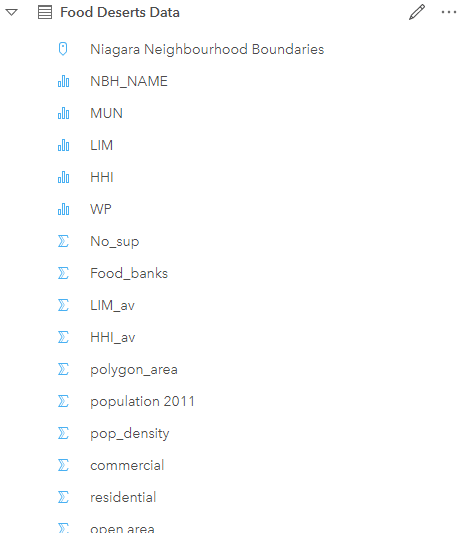
Note: I chose geography as the location type because the food Deserts Data did not have any coordinate or address attribute. Hence making it possible to correspond the food deserts data’s locations to that of the zipped Niagara Neighbourhood boundaries shapefile.
19 . Rename the following fields in the food deserts data in the data pane:
| From | To |
|---|---|
| NBH_NAME | Niagara Neighbourhoods |
| MUN | Municipality |
| No_sup | Number of Supermarkets |
| No. supermarket within 5km | Number of Supermarket within 5 km |
After completing the renaming, click on the Food Deserts Data to close the drop-down attribute.
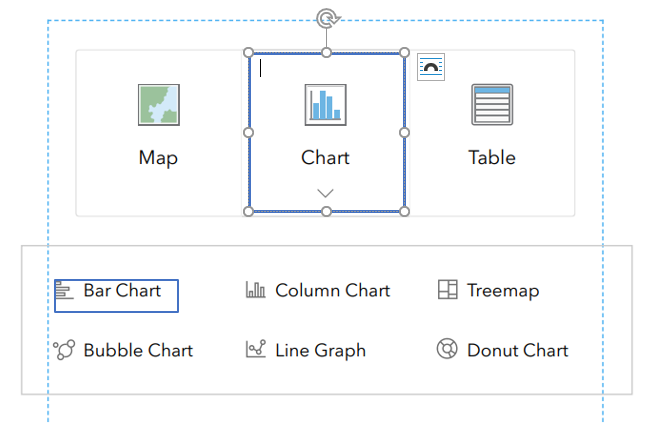
20 . In the data pane, Drag Food Deserts Data to your page and onto the Chart drop zone. And finally drag it to the Bar Chart zone.
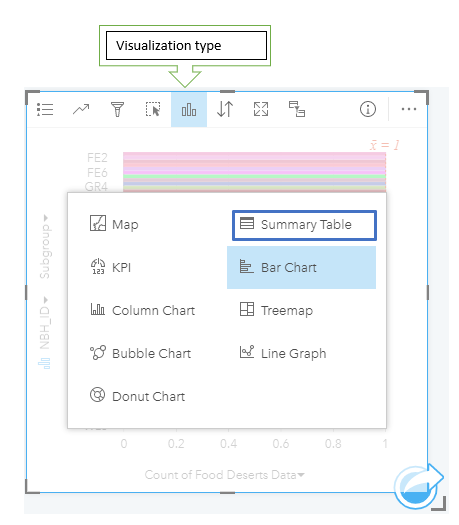
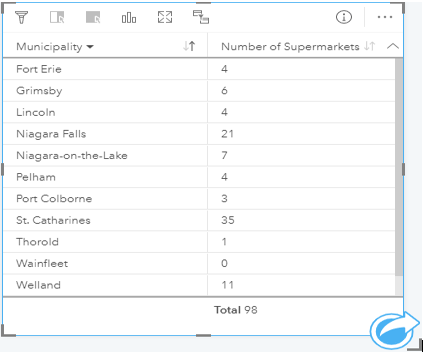
21 . Click on the Visualization type and select Summary table.
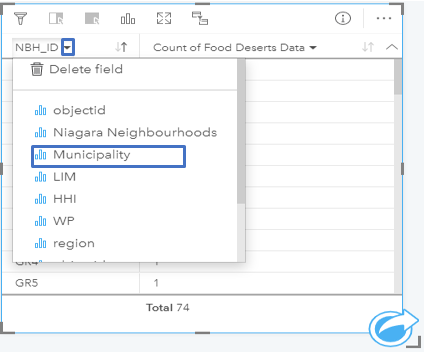
22 . Click on the NBH_ID drop down arrow and click on the field “Municipality”.
23 . Similarly click on theCounts of Food Deserts Data drop down arrow and click on “Number of Supermarkets”.

The Summary Table now depicts Municipalities in Niagara and their corresponding supermarket accessibility.
24 . Click Visualization type and select Bar Chart. Drag the center-right handle of the Bar Chart Card until the card is at a maximum length.
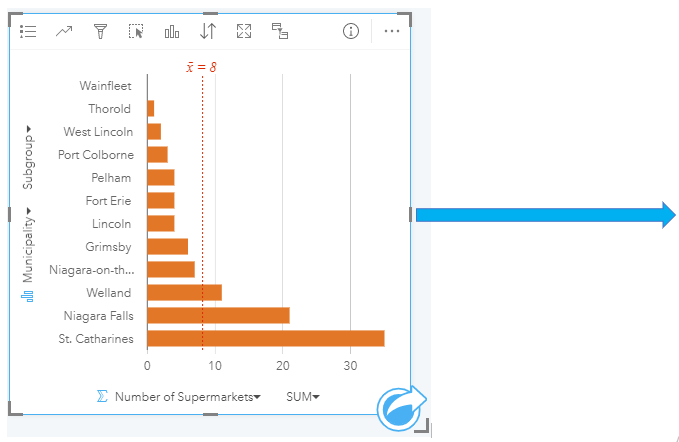
Changing the symbology of the bar chart card.
25 . First click on the ‘Legend’. Click Options inside the Layer option box. Change the Symbol type from Single symbol to Unique symbols and click “x” to close the layer option box. Finally click anywhere outside the Bar Chart Card.
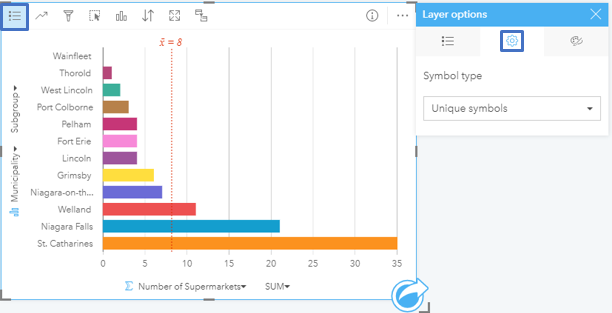
Note: Click on the bars to identify the number of supermarkets available to each municipality.
26 . Click on Card 1 and type “Number of Supermarkets by Municipality” as the title for the bar chart, and press Enter.
27 . Click Save.

Identifying Food Deserts Neighbourhoods in the Niagara Region
28 . In the data pane, Drag Food Deserts Data to your page below the Bar Chart Card and onto the Map drop zone.
29 . Click Legend, click the arrow to the right of the food deserts data as shown on the map.
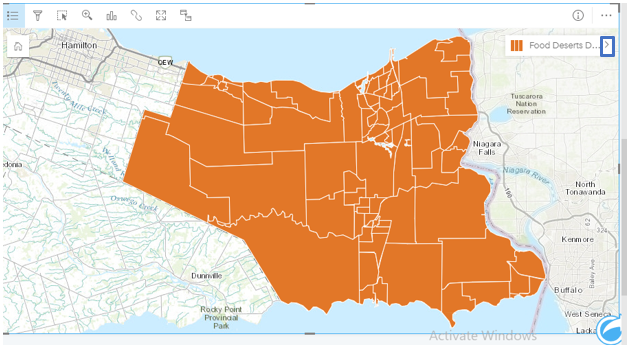
30 . The Layer options box pops up. Click Options. For Style by, choose Niagara Neighbourhoods and for the Symbol style confirm that it is Unique symbols. When finished close the Layer options box.
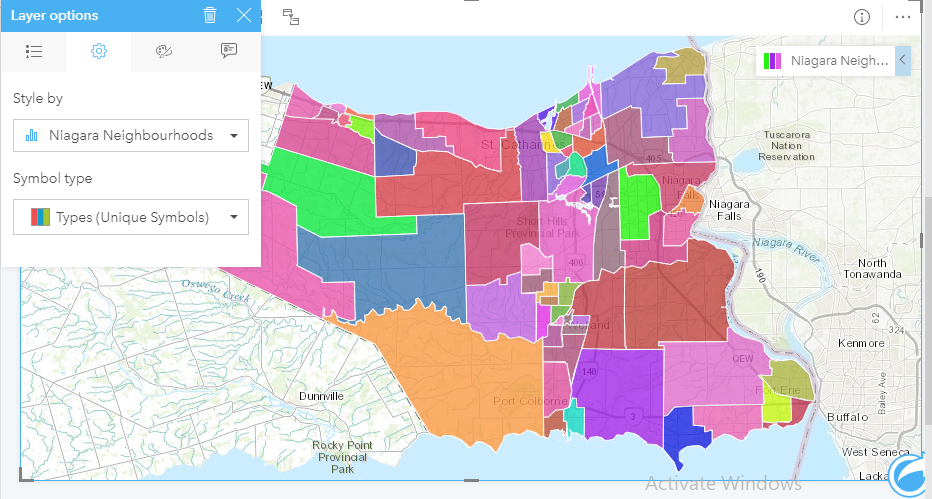
We now want to identify neighbourhoods with no access to supermarkets. 31 . Click on Card Filter.

32 . A new filter box pops-up. Below Filter By click on the Choose a field drop down arrow and select Number of supermarkets.
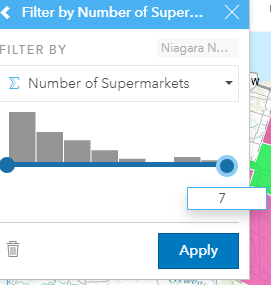
33 . Drag to you left from 7 until you reach 0. Click Apply and close Filter.
Below is the map of Niagara’s neighbourhoods without supermarkets.
Note: Click on each area on the map to identify neighbourhoods without supermarkets.
34 . Finally click anywhere outside the Map Card.
35 . Click on Card 1 and type “Niagara Neighbourhoods without Supermarkets” as the title for the Map, and press Enter.
36 . Click Save.
37 . Go to the Data pane, click Dataset at the right side of Food Deserts Data Map Result. Click Share Data.
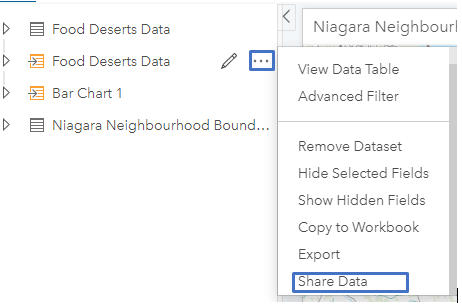
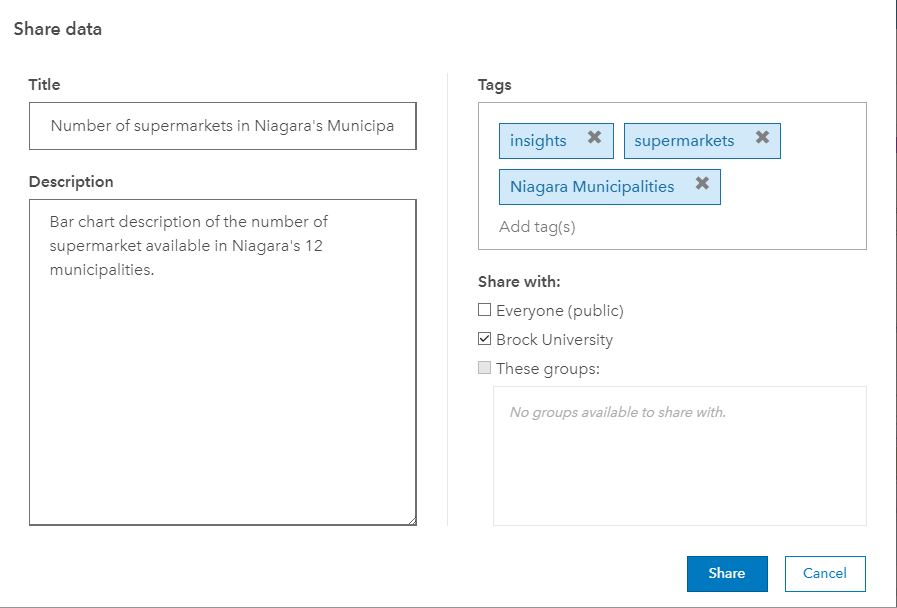
38 . Follow the steps in the Share data box below and click Share.
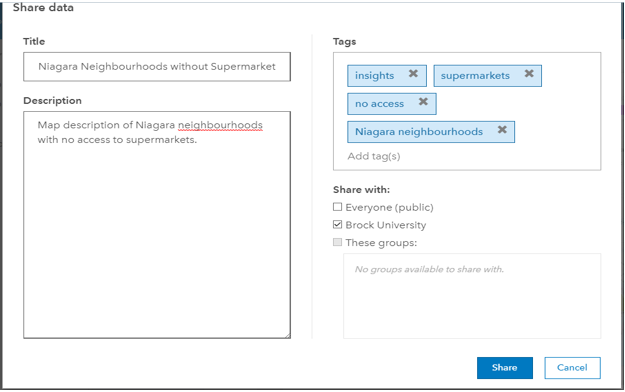
Once the data is shared, ‘Shared.Open Item’ appears below the Food Deserts Data as seen below.
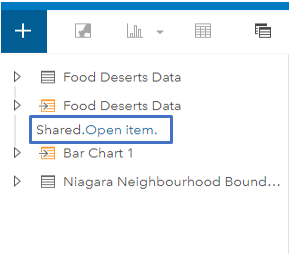
39 . Repeat the same process for Bar Chart 1 in the Data pane and follow the procedure in the shared data below. Click Share.
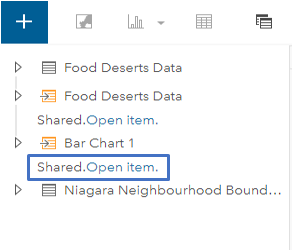
Once the data is shared, ‘Shared.Open Item’ appears below the Bar Chart 1 as seen below.
Identifying food deserts in Niagara neighbourhoods using distance parameters.
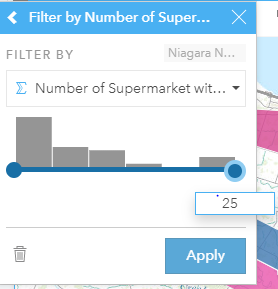
40 . Go back to the map. Click Card filter to add new filter. Click New Filter. For Filter by choose the field ‘Number of supermarkets within 5km’. Drag from 25 to 0 and click Apply.
Below is the map of Niagara’s food desert neighbourhoods without access to supermarkets within 5 km.
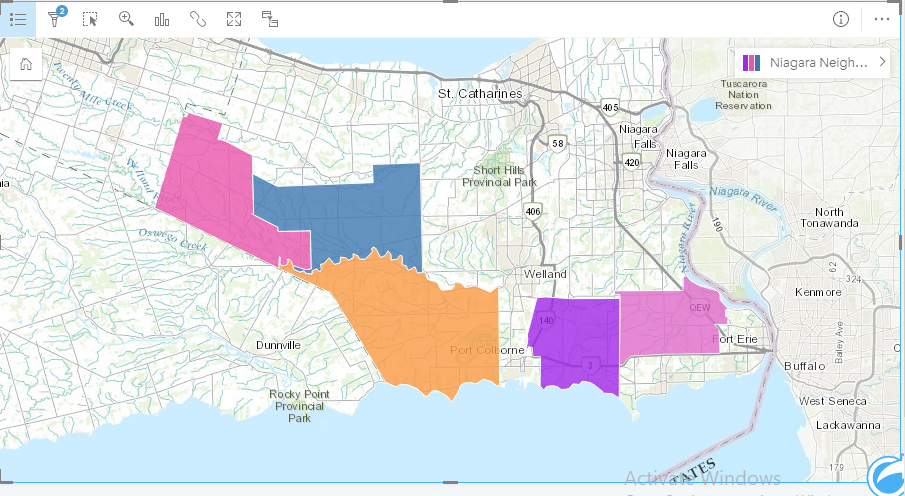
Note: Click on each area on the map to identify neighbourhoods considered as food deserts within 5 km.
41 . Click anywhere outside the Map card.
42 . Click on “Niagara Neighbourhoods without Supermarkets” and rename it as Niagara’s Food Desert Neighbourhoods by Distance, and press Enter.
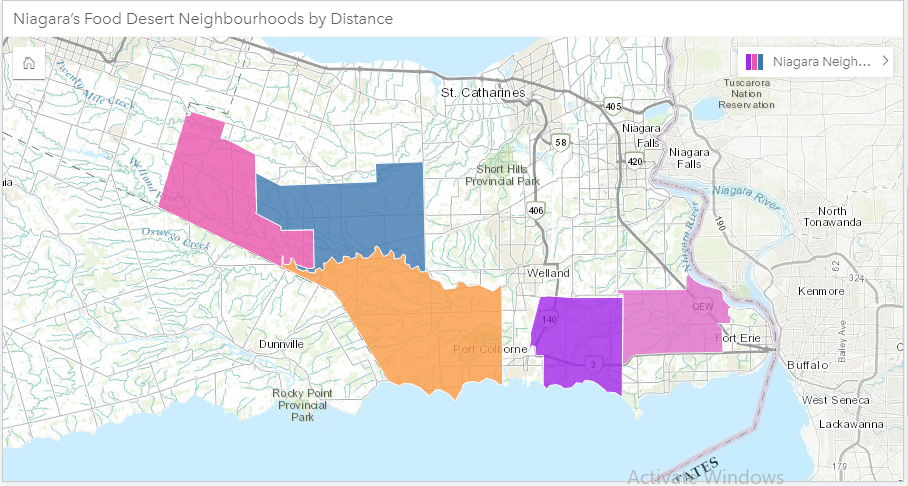
43 . Share the map using the same steps used for the first map result.
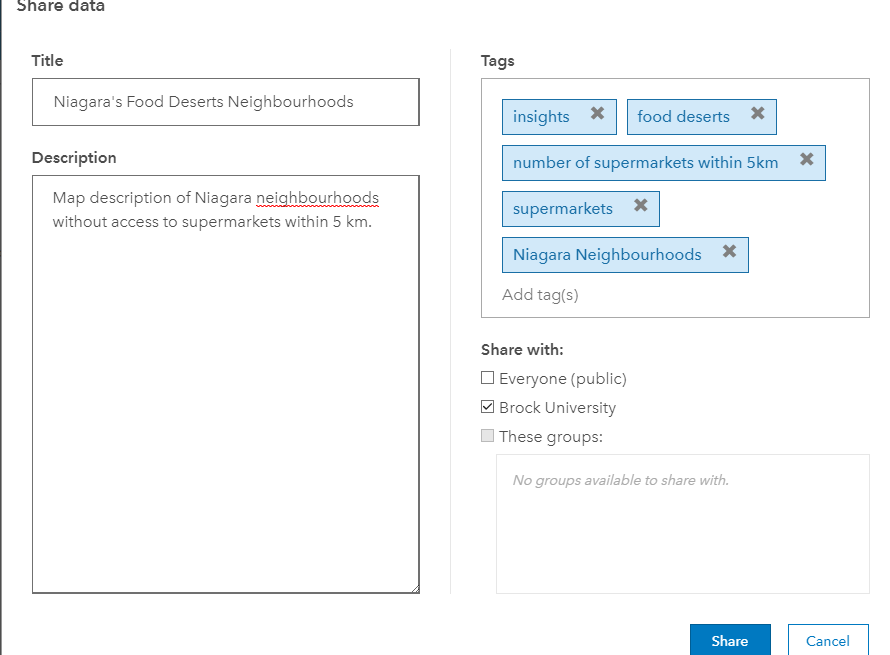
44 . Click Share.
45 . Finally Click Save.
Creating new shapefiles from my results.
46 . Go to the Food Desert Data map output dataset in the Data pane, click Dataset and click Export, and finally select Shapefiles.
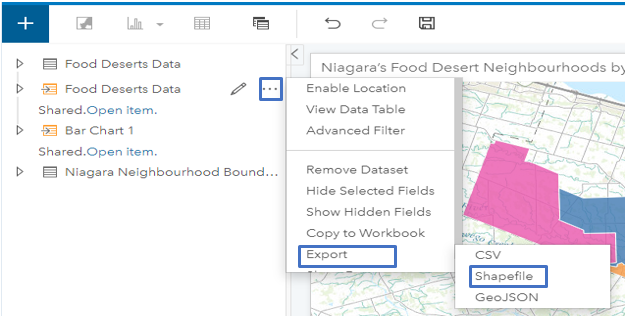
47 . Save the new shapefile to your desired location on your computer.

48 . You can also repeat this above process to also create a shapefile for the Bar Chart as well.
Conclusion
This project explored the potential of ArcGIS Insight in identifying Niagara’s food desert Neighbourhoods.The findings revealed that neighbourhoods deemed as food deserts within 5 km were Caistor, Wainfleet, Gainsborough, Bethel/Gasline/Sherkston and Stevensville. Results from the project were also shared on ArcGIS online. Finally, new shapefiles were created from the project results.
**Thank you and have a prosperous New Year**.