Scholars GeoPortal - How to…
The following is a brief tutorial guiding the user through search and download steps using Scholars GeoPortal, a search and discovery platform directed towards Ontario Universities.
Navigating the Portal
- Go to http://geo.scholarsportal.info/
- If you are accessing the geoportal off-campus, click the login link at the top, middle of the page. Select your institution and sign in using your credentials.
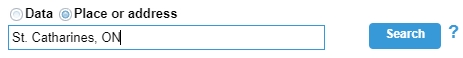
- Select the Place or Address search option and enter “St. Catharines, ON”.
-
Click Search.
- Click ZOOM for the geocoded result. The map zooms to the St. Catharines area.
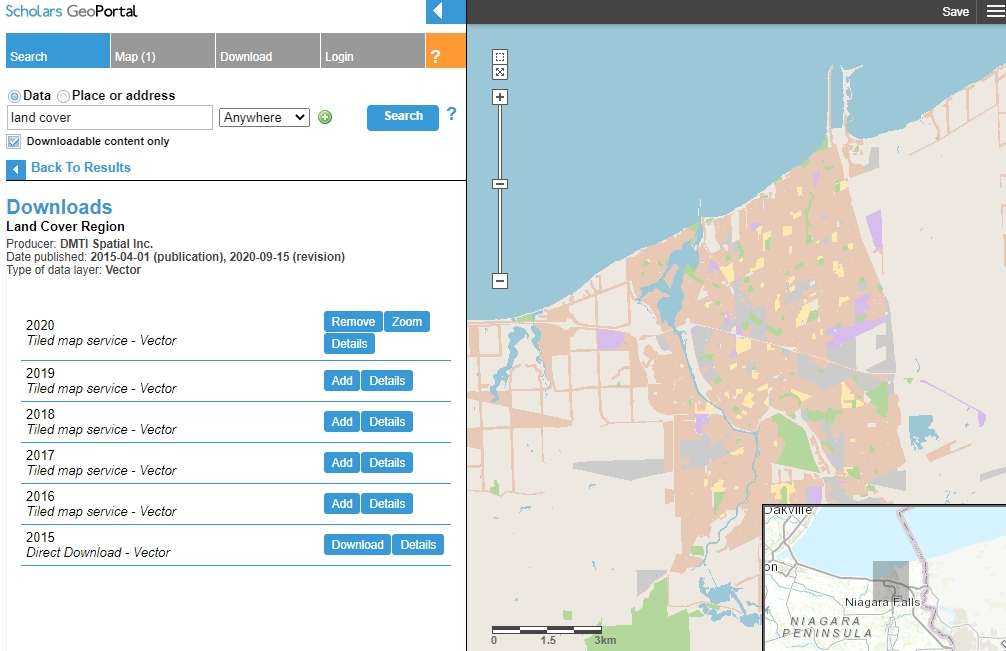
- Select the Data search option and enter a keyword, such as “land cover”.
- Click Search.
- From the results list, find “Land Cover Region”
- Click the blue DETAILS button to access metadata about the resource.
- Click the blue button below the data title “Add-1/6”
-
Add the 2020 data layer. When prompted with the Conditions of Use statement, click Accept to continue.
- Click “Back to Results” below the search window.
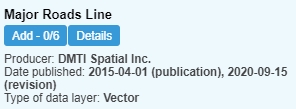
- Enter a new search term in the search window (i.e. “roads”).
-
Find the layer named “Major Roads Line” and add the 2020 layer to the map.
- Repeat the above steps to search, browse and add data layers to the map.
Downloading data
- Click the Download tab.
- Select “Download by area of interest”.
- Select “Draw an area”.
-
Use the rectangle tool to draw a box on the map view. If you want to define a new selection area, click the X beside the rectangle tool to clear the map.
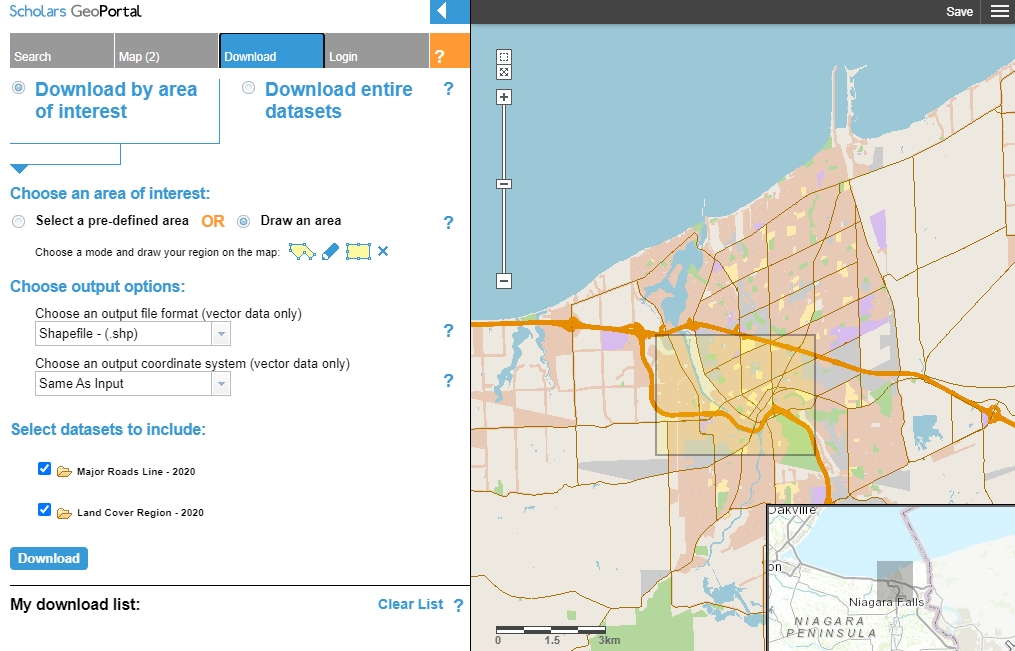
- Click the blue Download button. Depending on the number of layers, this could take several minutes.
-
The options for downloading clipped data will appear in the “My Download List”
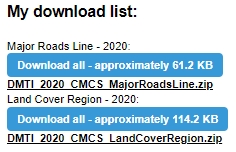
- Click each zip file in turn to download the data to your local DOWNLOADS directory.
Unzipping a file
-
If you are using Chrome, click the UP arrow beside the downloaded file (at the bottom of the window) and click “Show in Folder”.
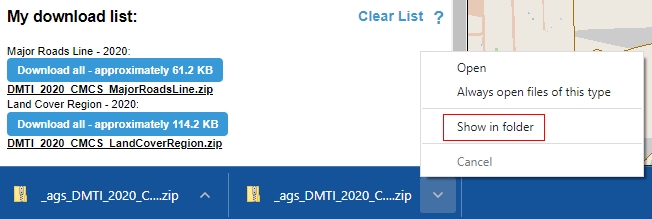
- Right-click the zip folder and select “Extract all”. You can identify an appropriate location or accept the default (MY DOWNLOADS).
- Run your GIS software and add the files according to your workflow.
A detailed User Guide is available here https://learn.scholarsportal.info/all-guides/geoportal/usinggeoportal/
This tutorial is brought to you by the Brock University Map, Data & GIS Library E-mail us at maplib@brocku.ca
You can also find us on:
Facebook
Twitter
Instagram